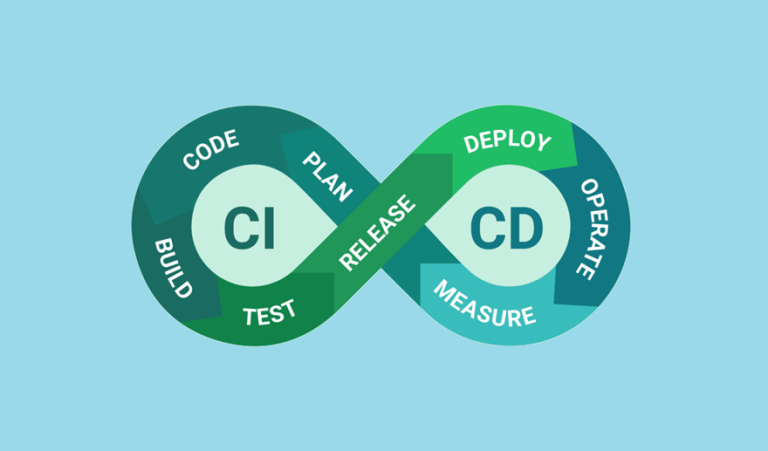
Observability in CI/CD: Monitoring Builds and Deployments
Observability in CI/CD pipelines is more than just monitoring build results; it provides insight into workflow efficiency, deployment health, and reliability. For Spring applications, integrating observability tools like Prometheus, Grafana, or Datadog can empower teams to track build statuses, deployment metrics, and respond proactively to issues. Additionally, real-time notifications and alerts help developers stay informed, ensuring faster resolution of failures and improved Mean Time to Recovery (MTTR).
This guide covers the integration of Prometheus and Grafana or Datadog for observability, tracking key metrics, setting up real-time notifications (Slack/email), and alerting on failures to enhance the visibility and reliability of CI/CD pipelines.
Table of Contents
- Why Is Observability Important in CI/CD?
- Integrating Prometheus and Grafana or Datadog
- Tracking Deployment Frequency and MTTR
- Setting up Slack or Email Notifications
- Alerting on Build and Deployment Failures
- Best Practices for CI/CD Observability
- Final Thoughts
Why Is Observability Important in CI/CD?
CI/CD pipelines automate the build and deployment process, but issues such as failed builds, slow deployments, or undetected outages can compromise application quality and reliability. Observability helps by providing:
- Proactive Issue Detection: Identify build or deployment bottlenecks before they escalate.
- Insight into Metrics: Track trends like deployment frequency, test durations, and MTTR to ensure continuous improvement.
- Real-Time Feedback: Notify developers immediately about failures, improving response times.
By integrating observability, teams can deliver updates faster and make data-driven improvements.
Integrating Prometheus and Grafana or Datadog
Setting up Prometheus for CI/CD Metrics
Prometheus is a powerful open-source monitoring toolkit that collects metrics from CI/CD pipelines, applications, and infrastructure. For Spring apps, Prometheus can monitor key metrics and export them to querying dashboards.
- Add Spring Actuator to Expose Metrics:
Ensure your Spring Boot app provides metrics that Prometheus can scrape. Add the following dependencies inpom.xml:
<dependencies>
  <dependency>
    <groupId>org.springframework.boot</groupId>
    <artifactId>spring-boot-starter-actuator</artifactId>
  </dependency>
  <dependency>
    <groupId>io.micrometer</groupId>
    <artifactId>micrometer-registry-prometheus</artifactId>
  </dependency>
</dependencies>- Expose Metrics Endpoint:
Add this configuration toapplication.propertiesto enable Prometheus-compatible metrics:
management.endpoints.web.exposure.include=health,info,prometheus management.metrics.export.prometheus.enabled=true- Configure Prometheus to Scrape Metrics:
Define your Spring app in the Prometheus configuration file (prometheus.yml):
management.endpoints.web.exposure.include=prometheus
management.endpoint.prometheus.enabled=true- Start Prometheus with:
prometheus --config.file=prometheus.yml
Visualizing Data with Grafana
Grafana provides beautiful, customizable dashboards for visualizing data from Prometheus.
- Install Grafana:
Download and install Grafana for your operating system. For containerized environments:docker run -d -p 3000:3000 grafana/grafana - Add Prometheus as a Data Source:
- Navigate to Configuration → Data Sources in Grafana.
- Select Prometheus and provide the Prometheus server URL.
- Create Dashboards for CI/CD Metrics:
Import pre-built dashboards or create custom ones to monitor:- Build Failures: Percentage of failed builds.
- Deployment Durations: Trend of deployment times over releases.
- Application Health: Metrics like request counts, latencies, or error rates.
Using Datadog for CI/CD Observability
Datadog is a robust, cloud-native monitoring platform that integrates out-of-the-box with Jenkins, GitHub Actions, or GitLab.
- Set Up the Datadog Agent:
Install and configure the Datadog agent on the CI/CD runners:DD_API_KEY=<your_api_key> bash -c "$(curl -L https://s3.amazonaws.com/dd-agent/scripts/install_script.sh)" - Monitor Jenkins Pipelines:
- Install the Datadog plugin in Jenkins via the Plugin Manager.
- Configure the plugin with your Datadog API key and server information.
- Monitor Spring App Metrics:
Add the following configuration to send Spring Boot metrics to Datadog:management.metrics.export.datadog.api-key=<your-datadog-api-key> management.metrics.export.datadog.enabled=true
Datadog’s unified platform allows you to correlate CI/CD metrics with infrastructure and app performance.
Tracking Deployment Frequency and MTTR
Metrics like Deployment Frequency and Mean Time to Recovery (MTTR) measure the effectiveness of your CI/CD process.
Key Metrics for CI/CD Pipelines
- Deployment Frequency: Measures how often new changes are deployed to production.
- Lead Time for Changes: Time from code commit to deployment in production.
- MTTR: Time taken to recover from failures.
- Failure Rate: Percentage of builds or deployments that fail.
Measuring Deployment Frequency in Spring Apps
Instrument your pipelines to count successful deployments. For example, use Grafana or Datadog dashboards to:
- Track the
deploy_job_success_countmetric from your CI/CD pipeline. - Combine this with histograms to visualize deployment trends over time.
Setting up Slack or Email Notifications
Real-time alerting ensures developers can respond to issues immediately.
Slack Notifications for CI/CD
- Create a Slack Webhook:
- Go to Apps → Manage Apps in Slack.
- Search for Incoming Webhooks and add it.
- Copy the webhook URL.
- Send Notifications from CI/CD Pipelines:
Append Slack notifications to the pipeline YAML. For Jenkins:
post {
  always {
    slackSend(
      channel: '#ci-alerts',
      message: "Build ${BUILD_NUMBER} failed!",
      webhookTokenCredentialId: 'slack-webhook-token'
    )
  }
}
Email Notifications
For GitHub Actions: Add an email job:
jobs:
  notify:
    name: Email Notification
    runs-on: ubuntu-latest
    steps:
    - name: Send Email
      run: |
        echo "Build failed!" | mail -s "CI/CD Alert" team@example.com
Alerting on Build and Deployment Failures
Prometheus Alert Rules
Set up alerting rules in Prometheus to detect failures:
groups:
  - name: build_failures
    rules:
    - alert: BuildFailure
      expr: build_failure_total > 0
      for: 5m
      labels:
        severity: critical
      annotations:
        summary: "Build failures detected"
        description: "Build failures have been detected in the pipeline."
Integrating Alerts with Grafana
- Create alert rules in Grafana based on dashboard queries.
- Configure notification channels (Slack, email, PagerDuty).
- Example alert condition:
- If pipeline execution time exceeds 10 minutes, trigger an alert.
Best Practices for CI/CD Observability
- Monitor All Stages: Track everything from code commits to deployments.
- Automate Notifications: Use Slack or email to alert developers immediately after failures.
- Correlate Metrics: Align pipeline metrics (e.g., build times) with app performance metrics (e.g., latency).
- Start Simple: Focus on a few key metrics first, then expand observability as needs grow.
Final Thoughts
Observability is essential for maintaining healthy CI/CD pipelines and delivering reliable Spring applications. By integrating tools like Prometheus with Grafana or Datadog, and configuring notifications and alerts, teams can proactively detect and resolve issues, track progress through metrics like MTTR, and ensure robust software delivery processes.
Start by implementing basic monitoring for builds and slowly leverage advanced visualization, alerting, and notifications for maximum visibility and control in your CI/CD workflows.


